Search for $B^0 \to K_S^0\tau^+\tau^−$ decays at Belle and Belle II
| Abstract | We present the first search of $B^{0}\to K^{0}_{s}\tau^{+}\tau^{-}$ decays using the Belle and Belle II datasets and the hadronic B-tagging approach. |
|---|---|
| Tags | Belle Run 1 |
| Working group | Radiative and Electroweak Penguin |
| Principal authors | @ Ihor Prudiiev, Gaetano de Marino, Vidya Sagar Vobbilisetti, Debjit Ghosh, Niharika Rout, Mirco Dorigo, Karim Trabelsi, Diego Tonelli |
| Reference | submitted to JHEP |
| Links | arXiv:2607.25607, Inspire, |
| Bibtex |
@article{Belle-II:2026bbr,
    author = "Abumusabh, M. and others",
    collaboration = "Belle-II, Belle",
    title = "{Search for the $\boldsymbol{B^0 \to K^0_{\rm S} τ^+ τ^-}$ decay}",
    eprint = "2607.25607",
    archivePrefix = "arXiv",
    primaryClass = "hep-ex",
    reportNumber = "Belle II preprint 2026-008, KEK preprint 2026-4",
    month = "7",
    year = "2026"
}
|
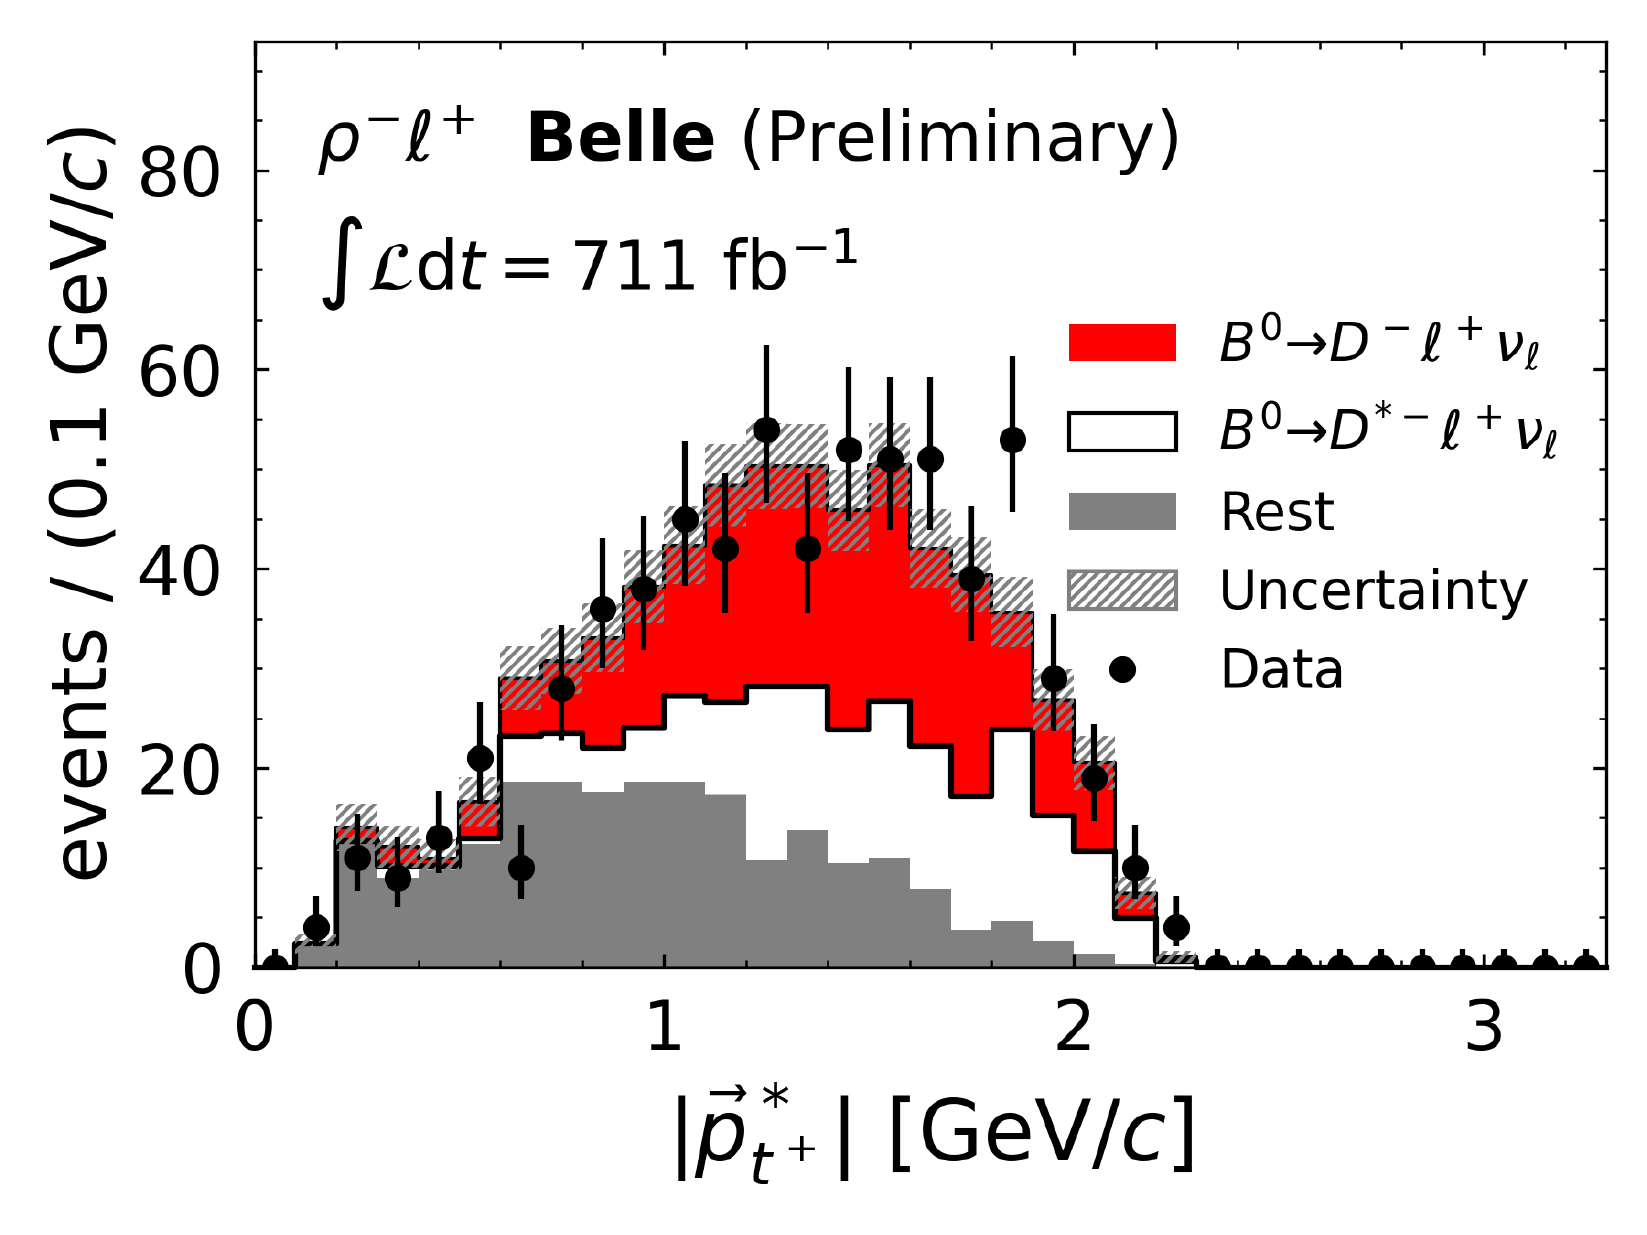
$|\vec{p}^{\,*}_{t^+}|$ distribution for the Belle events compatible with the $\rho^- \ell^+$ di-tau topology and belonging to the $M(K_{\rm S}^0 t^-)$ region of $(1.8,1.9)$~GeV/$c^2$, vetoed in the nominal selection. Data is represented by dots, while the stacked histograms represent the simulated events, divided into $B^0\to D^{(*)-}\ell^+\nu_\ell$ decays in filled red (empty) and all other backgrounds in filled grey. Uncertainties on the histograms represent the statistical uncertainty of the simulation. Yields in simulation are scaled to mirror the fit results in the $\mathcal{O}^\prime$ observable in the full range.
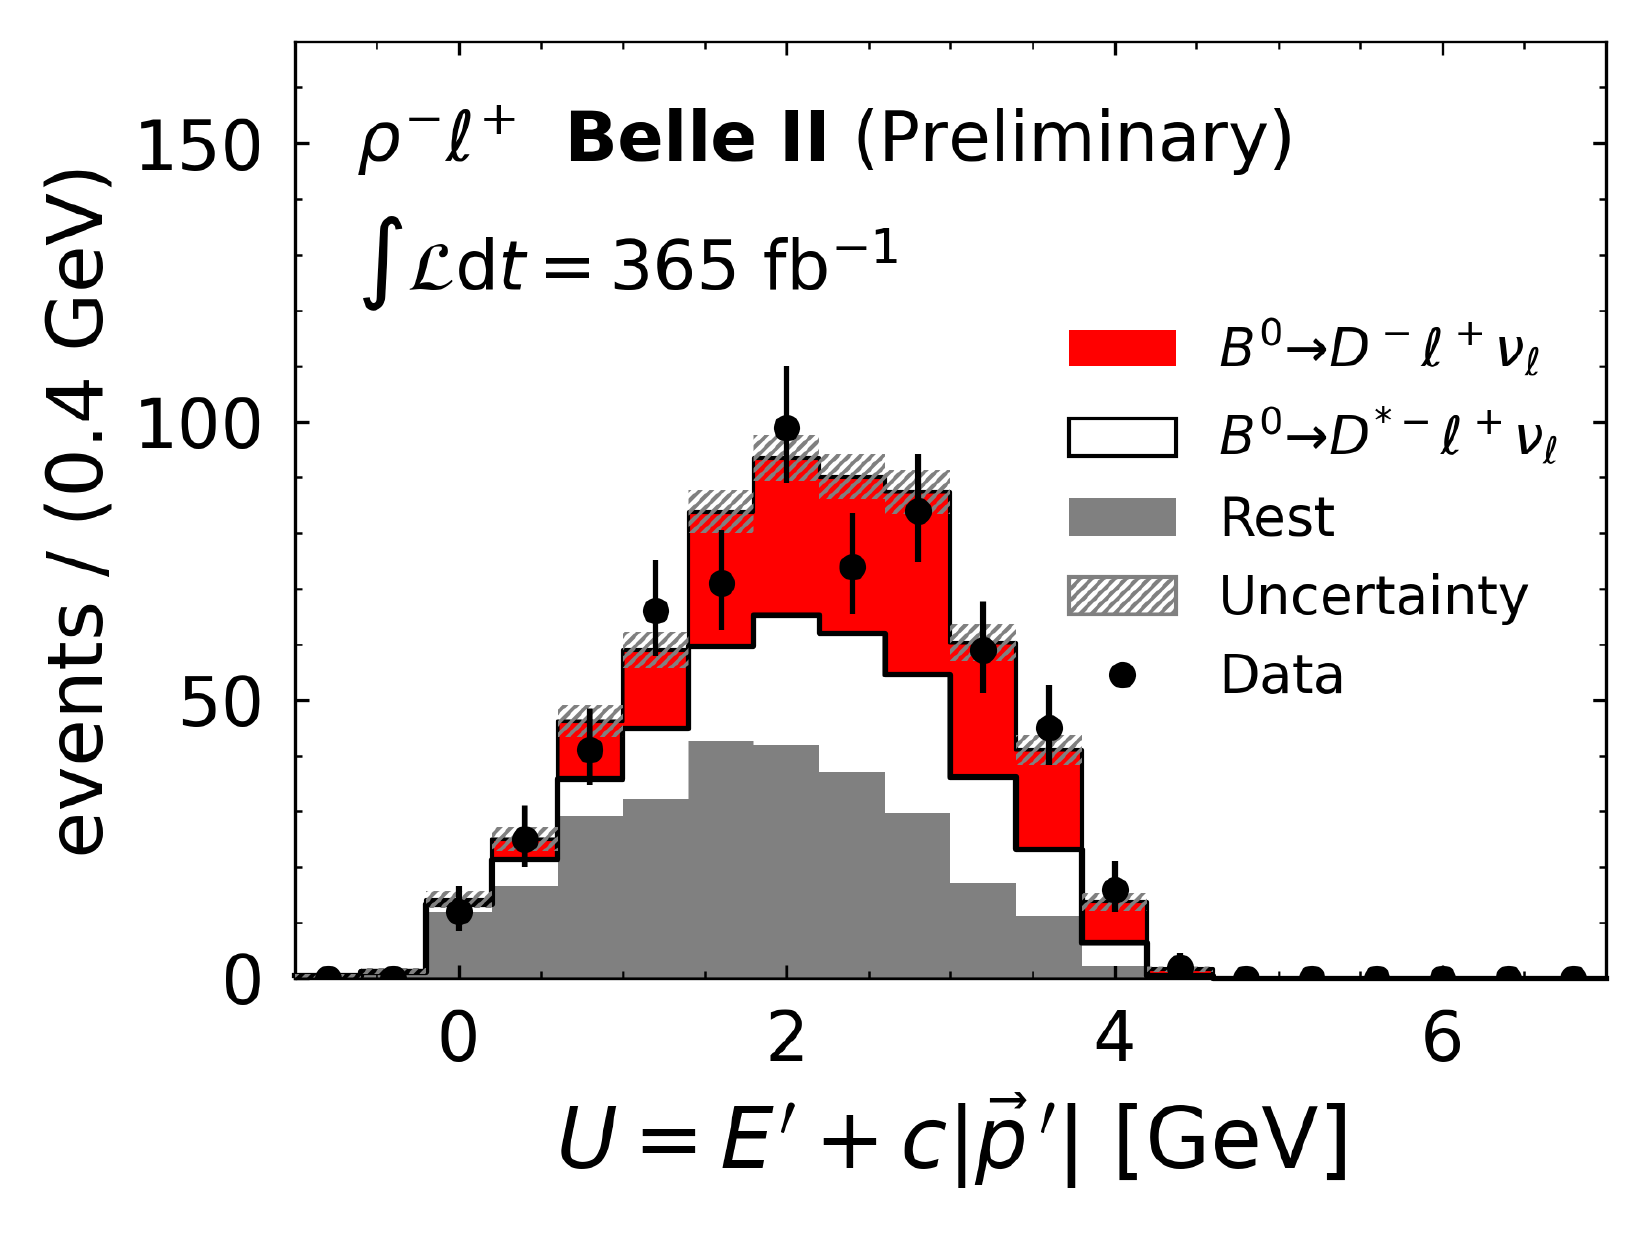
$U={E}^\prime+c|\vec{{p}}^{\,\prime}|$ distribution for the Belle II events compatible with the $\rho^- \ell^+$ di-tau topology and belonging to the $M(K_{\rm S}^0 t^-)$ region of $(1.8,1.9)$~GeV/$c^2$, vetoed in the nominal selection. Data is represented by dots, while the stacked histograms represent the simulated events, divided into $B^0\to D^{(*)-}\ell^+\nu_\ell$ decays in filled red (empty) and all other backgrounds in filled grey. Uncertainties on the histograms represent the statistical uncertainty of the simulation. Yields in simulation are scaled to mirror the fit results in the $\mathcal{O}^\prime$ observable in the full range.
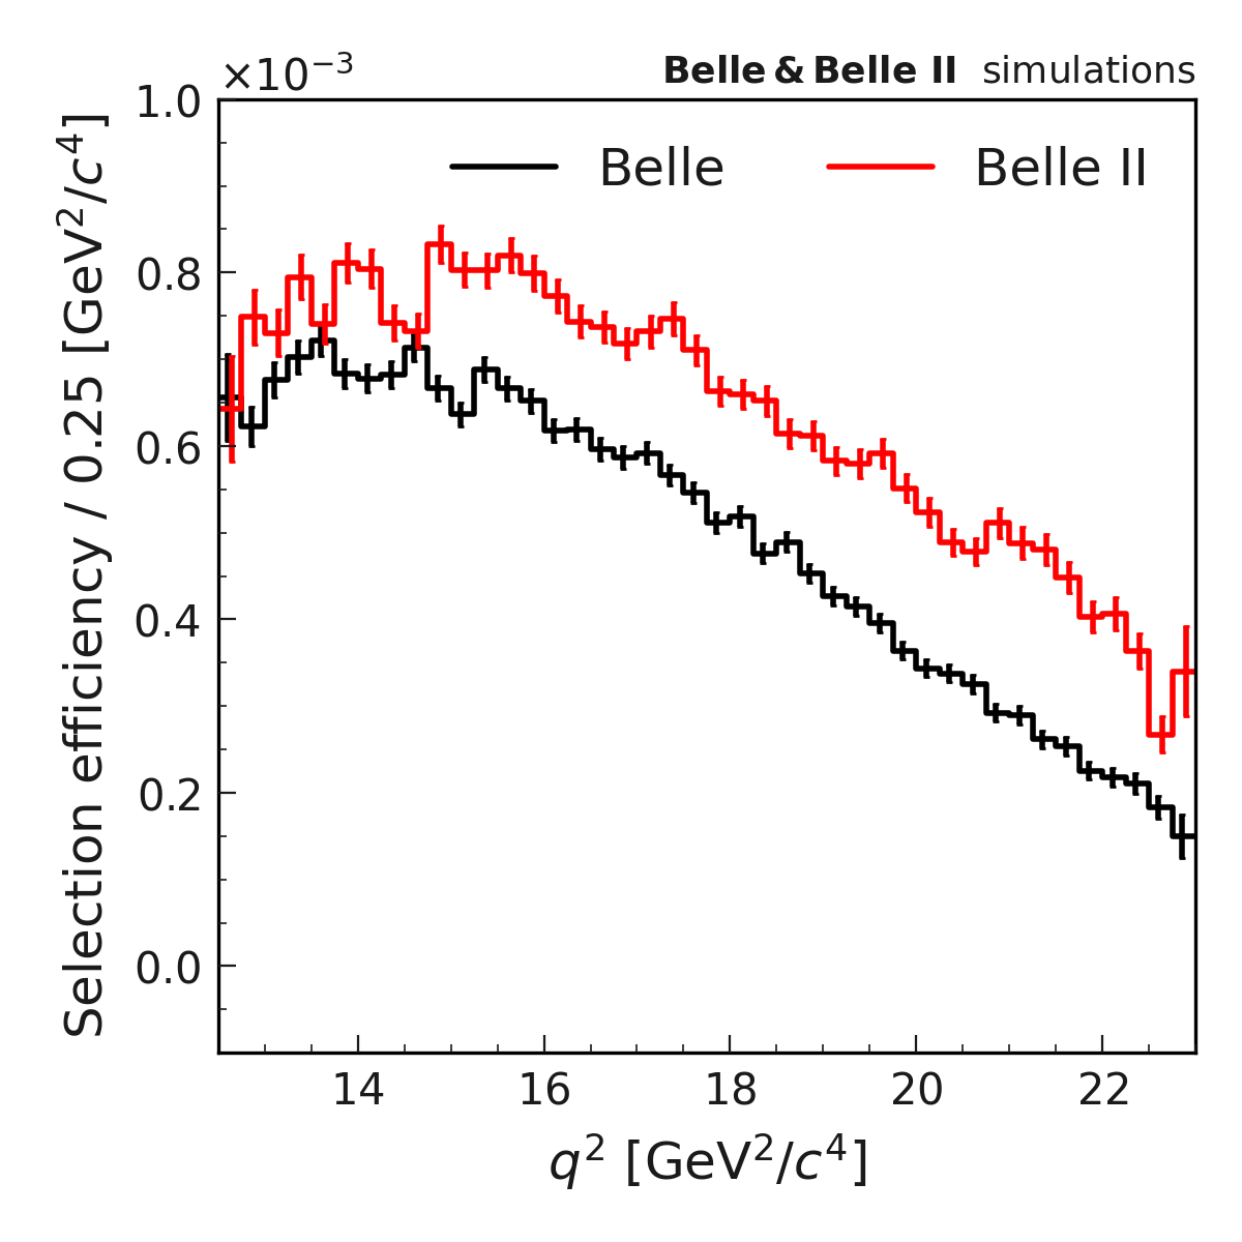
Total signal selection efficiency in Belle (black) and Belle II (red) as a function of $q^2$ from $B^0 \to K^0_{\rm S} \tau^+\tau^-$ signal simulation.
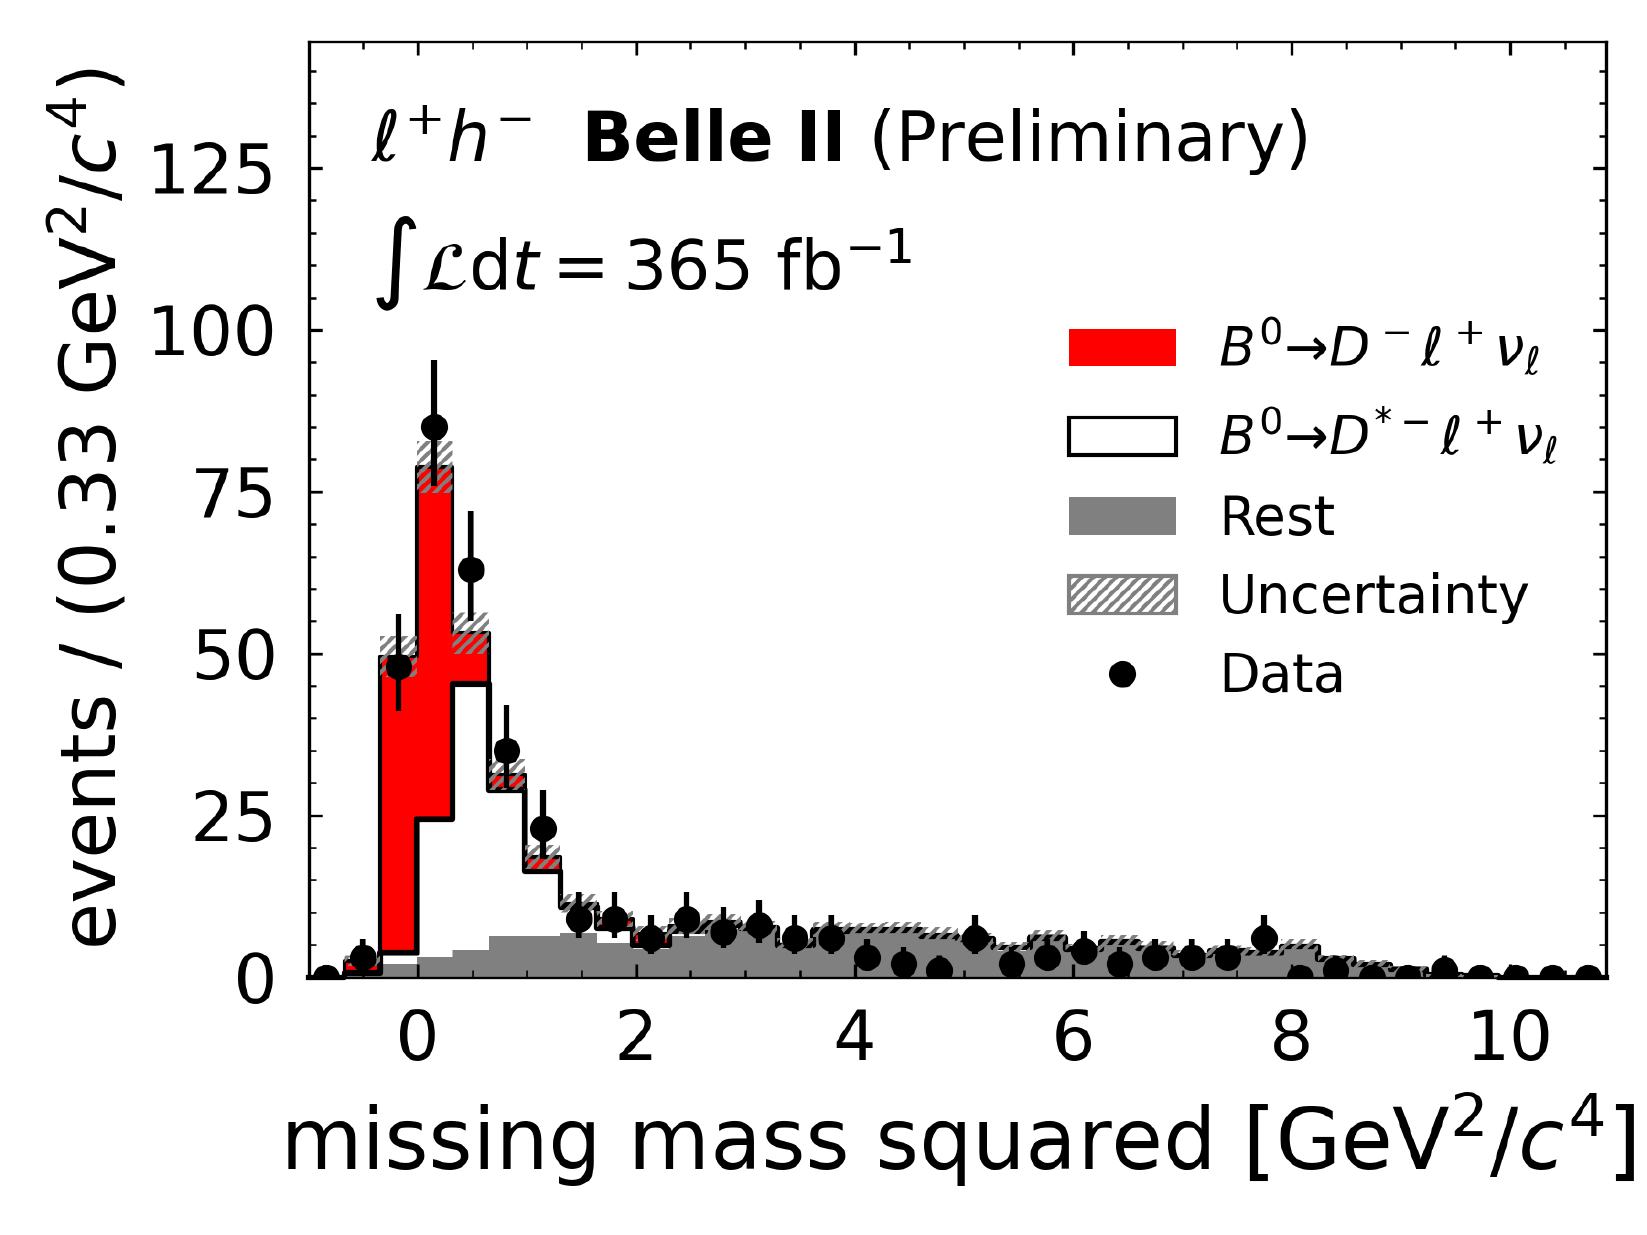
Missing mass squared distribution for the Belle II events compatible with the $\ell^+ h^-$ di-tau topology and belonging to the $M(K_{\rm S}^0 t^-)$ region of $(1.8,1.9)$~GeV/$c^2$, vetoed in the nominal selection. Data is represented by dots, while the stacked histograms represent the simulated events, divided into $B^0\to D^{(*)-}\ell^+\nu_\ell$ decays in filled red (empty) and all other backgrounds in filled grey. Uncertainties on the histograms represent the statistical uncertainty of the simulation. Yields in simulation are scaled to mirror the fit results in the $\mathcal{O}^\prime$ observable in the full range.
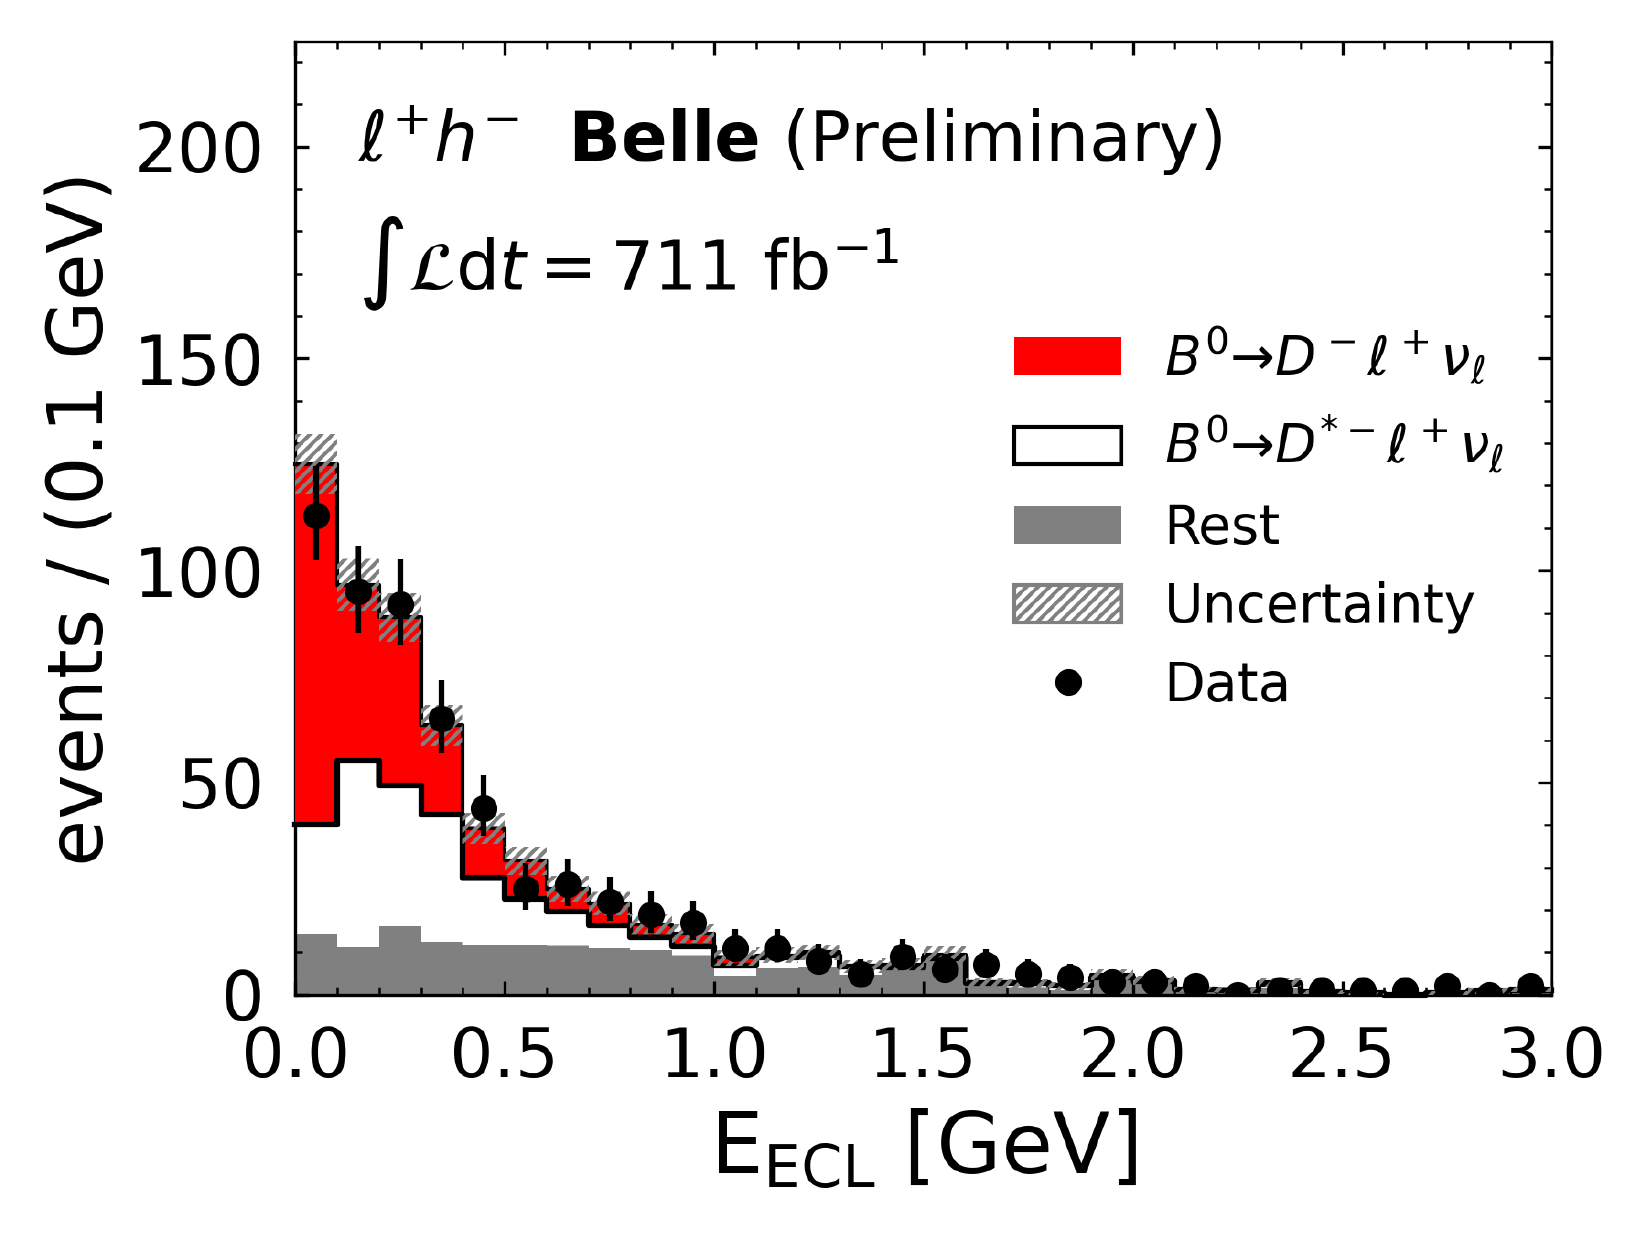
$E_{ECL}$ distribution for the Belle events compatible with the $\ell^+ h^-$ di-tau topology and belonging to the $M(K_{\rm S}^0 t^-)$ region of $(1.8,1.9)$~GeV/$c^2$, vetoed in the nominal selection. Data is represented by dots, while the stacked histograms represent the simulated events, divided into $B^0\to D^{(*)-}\ell^+\nu_\ell$ decays in filled red (empty) and all other backgrounds in filled grey. Uncertainties on the histograms represent the statistical uncertainty of the simulation. Yields in simulation are scaled to mirror the fit results in the $\mathcal{O}^\prime$ observable in the full range.
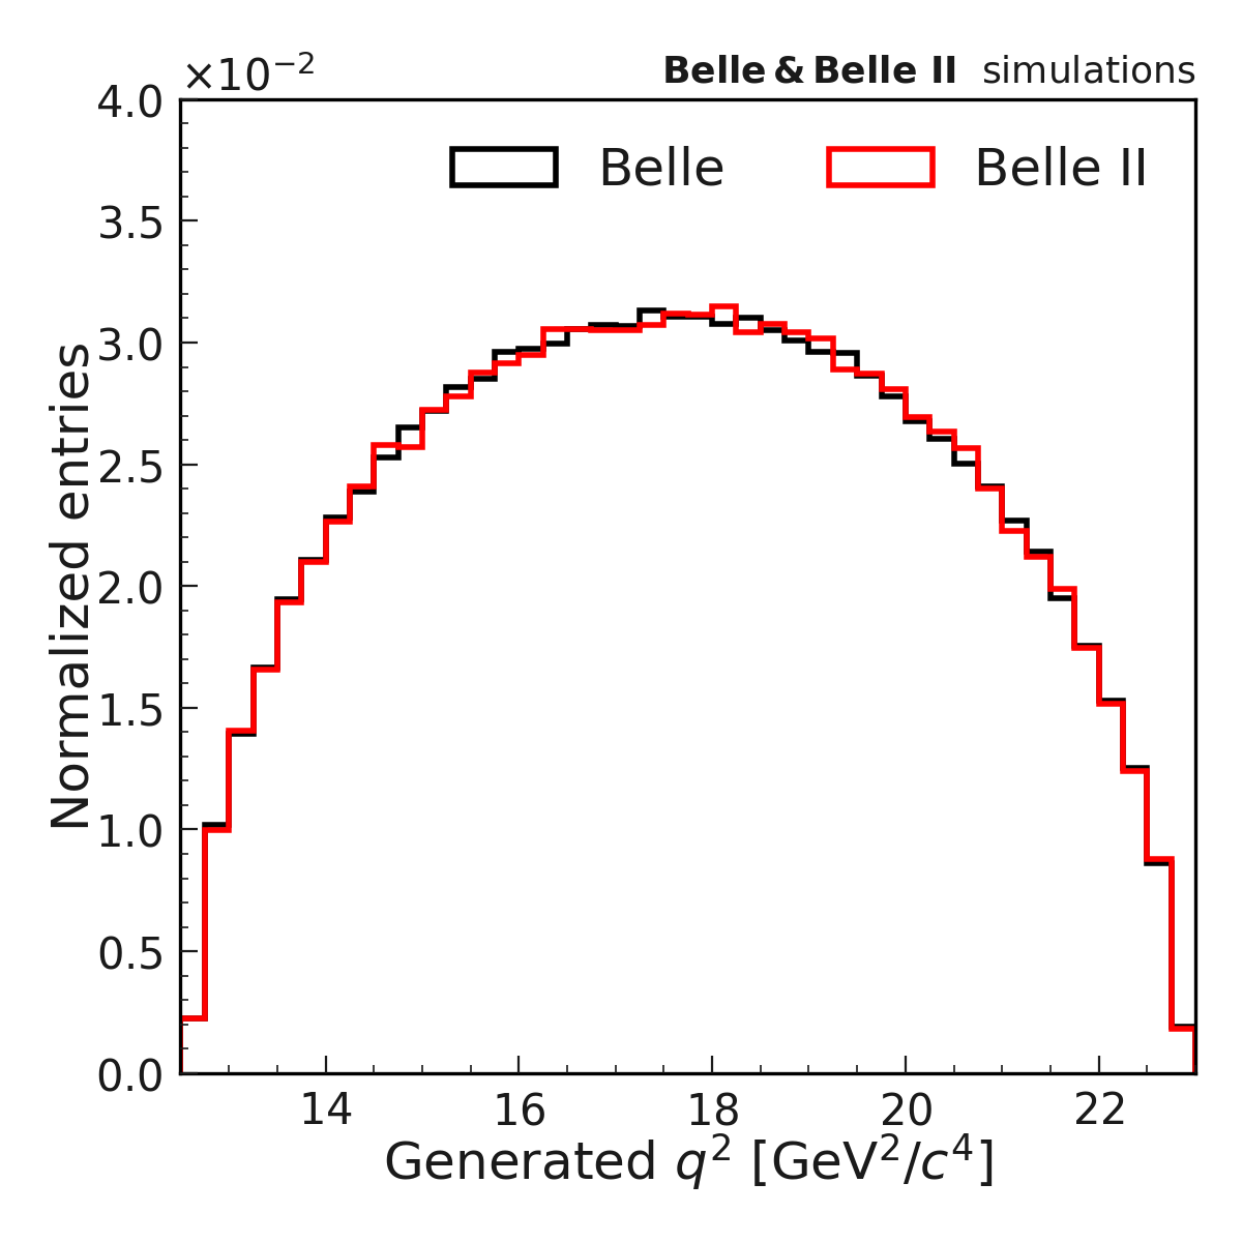
Generated $q^2$ distribution for Belle (black) and Belle II (red) $B^0 \to K^0_{\rm S} \tau^+\tau^-$ signal simulation.
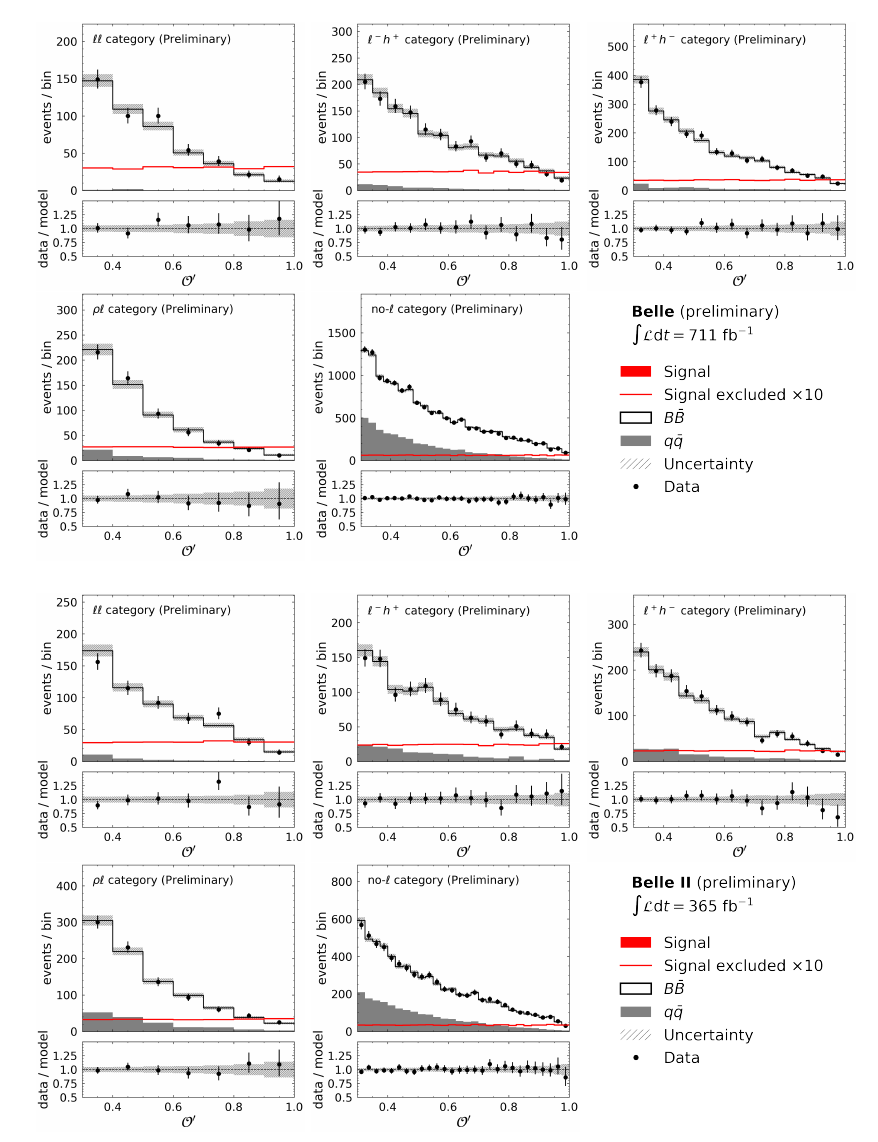
Distributions of $\mathcal{O}^\prime$ for candidates reconstructed in the Belle (upper five plots) and Belle~II (lower five plots) datasets together with the fit projections from a simultaneous fit. The red filled histogram (not visible) represents signal events at the branching fraction $\mathcal{B}(B^0 \to K^0_{\rm S} \tau^+\tau^-) = {1.2} \times 10^{-4}$. The simulated background contributions from $e^+e^- \to q\bar{q}$ (grey filled histogram) and $e^+e^- \to \Upsilon(4S) \to B\bar{B}$ (open histogram) are stacked and the sum of components is compared with data. The open red histogram (overlaid) illustrates the signal at a level ten times the exclusion limit on the branching fraction. The panels below each distribution show the ratio between the data and model. The uncertainties on the histograms represent the total model uncertainty as determined by the fit.
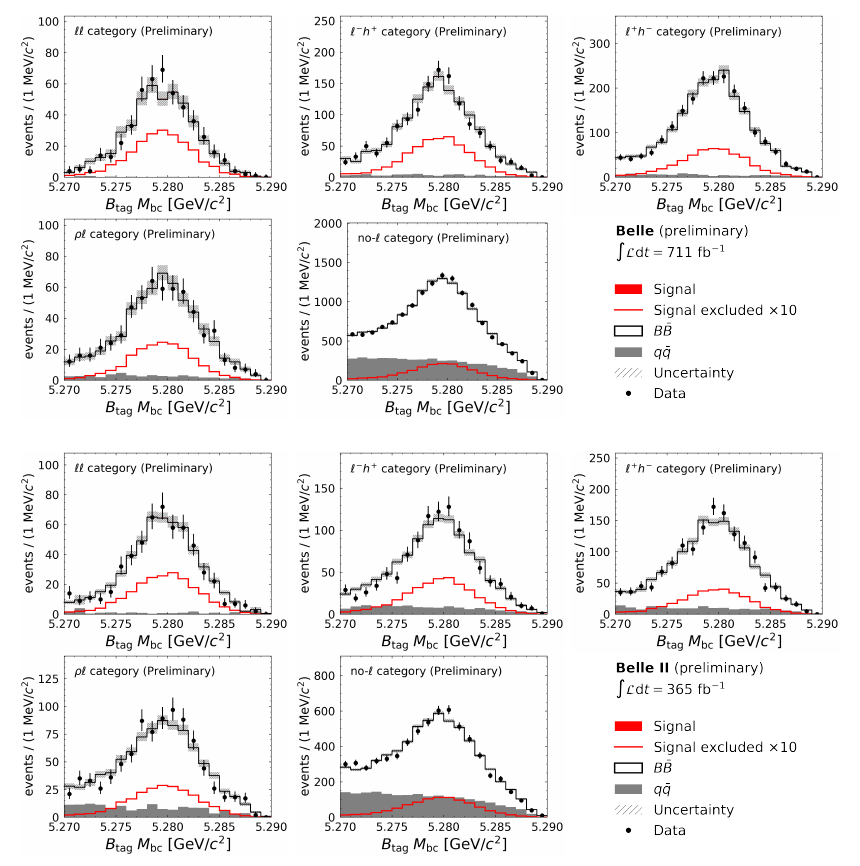
Distributions of $M_{\rm bc}$ for tag-side $B$ candidates reconstructed in the Belle (upper five plots) and Belle~II (lower five plots) datasets. Histograms from simulated samples are shown with yields rescaled to account for the simultaneous fit to the $\mathcal{O}^\prime$ observable. The red filled histogram (barely visible) represents the observed signal events at the branching fraction $\mathcal{B}(B^0 \to K^0_{\rm S} \tau^+\tau^-) = {1.2} \times 10^{-4}$. The simulated background contributions from $e^+e^- \to \Upsilon(4S) \to B\bar{B}$ (open histogram) and $e^+e^- \to q\bar{q}$ (grey filled histogram) are stacked and the sum of components is compared with data. The open red histogram (overlaid) illustrates the signal at a level ten times the exclusion limit on the branching fraction. The uncertainties shown on the histograms reflect the statistical uncertainties of the simulation.